Small and medium-sized enterprises (SMEs) are the backbone of the Austrian economy: 99.8 % of all enterprises are SMEs. These 588,000 companies employ more than 2.3 million people and generate revenues of € 510 billion.
| SME 2021 | Share in all companies | |
| Number of companies |
588,000
|
99.8 % |
| Persons employed | 2,374,400 | 66 % |
| Trainees | 53,900 | 58 % |
| Turnover | € 510 billion | 57 % |
| Value added | € 144 billion | 57 % |
| Balance sheet ratios 2021/222 | ||
| Equity ratio | 36 % | |
| Return on sales (after financial result) | 6.8 % | |
companies of the market-oriented economy (ÖNACE 2008 sections B – S and without S94); rounded values
2market-oriented economy excl. real estate and holdings
Sources: Statistics Austria, Austrian Institute for SME research
Methodological changes (in German)
SME data for selected industries:
Sources: Statistics Austria, Austrian Institute for SME Research (rounded values) Sources: Statistics Austria, Austrian Institute for SME Research (rounded values) Sources: Statistics Austria, Austrian Institute for SME Research (rounded values) Sources: Statistics Austria, Austrian Institute for SME Research (rounded values) Sources: Statistics Austria, Austrian Institute for SME Research (rounded values) Sources: Statistics Austria, Austrian Institute for SME Research (rounded values) Sources: Statistics Austria, Austrian Institute for SME Research (rounded values) Sources: Statistics Austria, Austrian Institute for SME Research (rounded values) Sources: Statistics Austria, Austrian Institute for SME Research (rounded values) Sources: Statistics Austria, Austrian Institute for SME Research (rounded values) Sources: Statistics Austria, Austrian Institute for SME Research (rounded values)Manufacturing
SME 2021
Share in all companies
Number of companies
30,400
98.4 %
Persons employed
310,900
44 %
Trainees
11,400
46 %
Turnover
€ 70 billion
29 %
Value added
€ 22 billion
32 %
Balance sheet ratios 2021/22
Equity ratio
39 %
Return on sales (after financial result)
6.6 %
Construction
SME 2020
Share in all companies
Number of companies
99.8 %
Persons employed
276,900
79 %
Trainees
15,800
82 %
Turnover
€ 46 billion
72 %
Value added
€ 16 billion
72 %
Balance sheet ratios 2021/22
Equity ratio
31 %
Return on sales (after financial result)
5.7 %
Trade
SME 2021
Share in all companies
Number of companies
99.8 %
Persons employed
441,000
62 %
Trainees
12,900
49 %
Turnover
€ 192 billion
69 %
Value added
€ 28 billion
64 %
Balance sheet ratios 2021/22
Equity ratio
38 %
Return on sales (after financial result)
5.2 %
Transportation
SME 2021
Share in all companies
Number of companies
15,600
99.6 %
Persons employed
115,700
54 %
Trainees
650
27 %
Turnover
€ 22 billion
50 %
Value added
€ 6 billion
43 %
Balance sheet ratios 2021/22
Equity ratio
37 %
Return on sales (after financial result)
4.1 %
Accomodation and food service
SME 2021
Share in all companies
Number of companies 2020
46,800
99.9 %
Persons employed
254,400
93 %
Trainees
5,400
88 %
Turnover
€ 13 billion
90 %
Value added
€ 9 billion
92 %
Balance sheet ratios 2021/22
Equity Ratio
26 %
Return on sales (after financial result)
10.8 %
Information and communication
SME 2021
Share in all companies
Number of companies
29,400
99.8 %
Persons employed
99,200
71 %
Trainees
600
63 %
Turnover
€ 16 billion
56 %
Value added
€ 7 billion
56 %
Balance sheet ratios 2021/22
Equity Ratio
37 %
Return on sales (after financial result)
9.3 %
Professional, scientific and technical activities
SME 2021
Share in all companies
Number of companies
99.96 %
Persons employed
253,500
93 %
Trainees
1,200
82 %
Turnover
€ 28 billion
89 %
Value added
€ 14 billion
90 %
Balance sheet ratios 2021/22
Equity Ratio
36 %
Return on sales (after financial result)
14,9 %
Administrative and support service activities
SME 2021
Share in all companies
Number of companies
99.5 %
Persons employed
138,600
54 %
Trainees
900
83 %
Turnover
€ 16 billion
71 %
Value added
€ 9 billion
64 %
Balance sheet ratios 2021/22
Equity Ratio
33 %
Return on sales (after financial result)
8.9 %
Education
SME 2021
Share in all companies
Number of companies
99.95 %
Persons employed
36,900
83 %
Trainees
200
7 %
Turnover
€ 1.4 billion
80 %
Value added
€ 1 billion
72 %
Balance sheet ratios 2021/22
Equity Ratio
32 %
Return on sales (after financial result)
11 %
Human health and social work activities
SME 2021
Share in all companies
Number of companies
99.9 %
Persons employed
181,200
77 %
Trainees
600
54 %
Turnover
€ 14 billion
77 %
Value added
€ 9 billion
76 %
Balance sheet ratios 2021/22
Equity Ratio
42 %
Return on sales (after financial result)
10,6 %
Arts, entertainment and recreation
SME 2021
Share in all companies
Number of companies
99.97 %
Persons employed
52,100
88 %
Trainees
300
87 %
Turnover
€ 3 billion
74 %
Value added
€ 1.5 billion
72 %
Balance sheet ratios 2021/22
Equity Ratio
44 %
Return on sales (after financial result)
6.2 %
SME definition:
In Austria, the European Commission’s definition of SMEs applies. The European Commission has defined the following for small and medium-sized enterprises (SMEs):
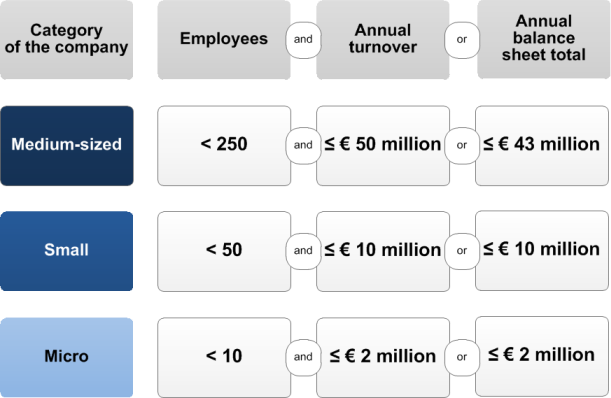
Note: The values shown apply from 1 January 2005 and represent maximum limits.
In general, most SMEs are autonomous, i.e. they are either completely independent or have partnerships with other companies with one or more minority holdings (each less than 25% each). If that holding is higher but does not exceed 50%, the relationship is deemed to be between partner enterprises.
Source: European Commission
For further information: User guide to the SME definition
As particularly structural data from official statistics are only available based on employee categories, a considerable amount of data is classified only by the number of employees.
Statistical resources:
In Austria, there are two large providers of structural data on SMEs, whereby in both cases only the employee criterion is used.
Statistics Austria publishes annual data on the Austrian business landscape in its Structural Business Statistics. Data classified by the number of employees as well as ÖNACE 2008 industries can be queried via the following link: to Statistics Austria
Within the framework of employment statistics, the Austrian Federal Economic Chamber publishes data on companies classified by company size according to the chamber classification. Further statistics regarding SMEs in Austria can be obtained via the following link (only available in German): to the Austrian Federal Economic Chamber
Publications:
The report “KMU im Fokus” (SME report) is produced on behalf of the Federal Ministry for Labour and Economy (BMAW) and is published regularly (only available in German):